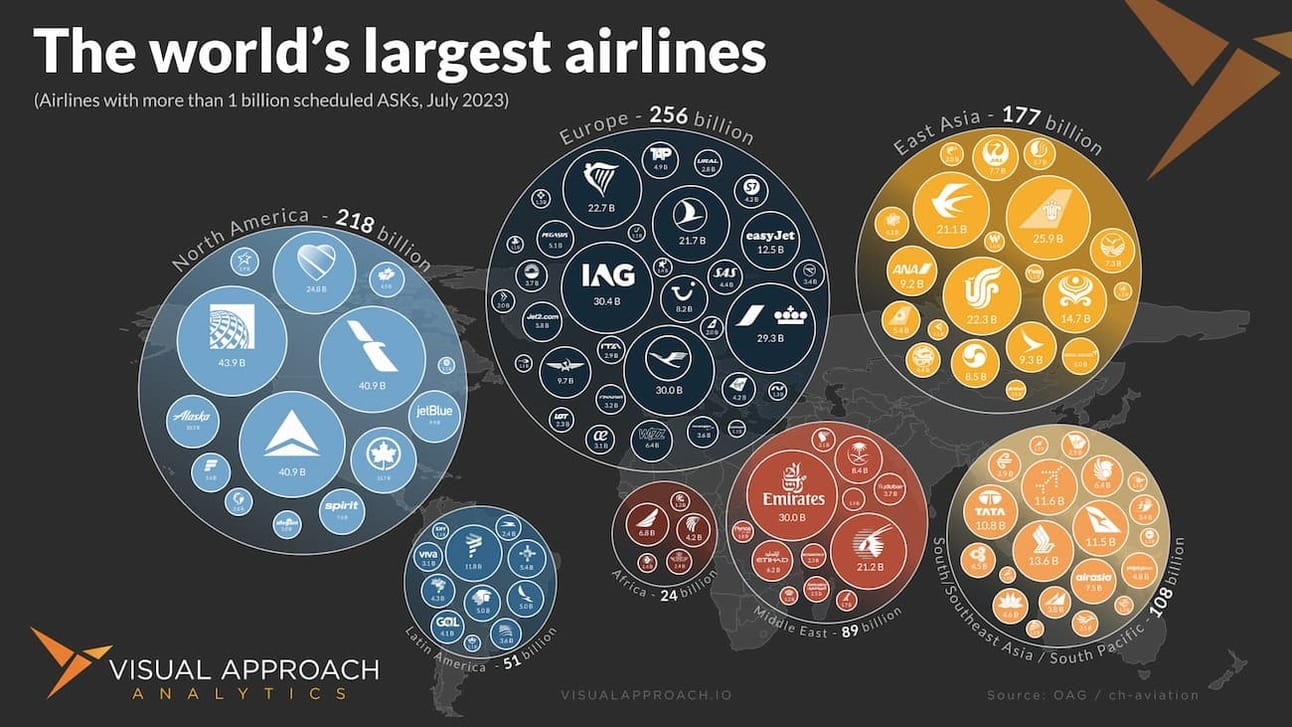
Just how fragmented is the airline market? It depends.
Sometimes we like to zoom out and look at the global view of commercial aviation. For airlines, it’s an interesting view. Europe remains the largest overall region by available seat kilometers but also the most fragmented.
Looking at airlines with over 1 billion ASKs scheduled for July, European airlines produce the greatest number of ASKs but also do it with a much larger number of airlines. Even after combining airlines by holding companies, European fragmentation is substantial.
East Asia is a cacophony of logos centered around three large China airlines. Even with the strength of ANA, JAL, and Korean Air, the relative strength of the Chinese market is apparent. That strength is not duplicated in India, even though the country just officially surpassed China in population. Indeed, we found the Indian carriers more appropriately grouped with the Southeast Asian carriers from their growth into developing markets. This, alone, highlights a significant difference in commercial aviation between the two countries.
The Middle East shows the dominance of Emirates and Qatar Airways, deploying capacity almost exclusively between regions. The connecting operations of the two airlines deliver an incredible amount of capacity, much of it pointed directly at India.
While we worked hard to align airlines with their holding companies (those with greater than 50% holdings), it was a challenging exercise. Let us know if you see any we missed.
We’re expanding Visual Approach Research

We supply investors, lessors, and airlines with regular market research on the aircraft market. You’ve heard of the Aircraft Intelligence Monthly (or you should have), but what you likely haven’t heard is we are growing our research offering.
Coming soon, we’ll be introducing additional insights to our AIM clients by way of Visual Approach Research. We have already added a full-sized chart library of our monthly trends for subscribers and will be adding more visualizations and contrarian insights alongside a new website.
What type of trends and insights are in our research? Take the above image, for example. In our July AIM, we identified a trend in the ABS market which allows us to forecast the return of the security. Will it return? When? What will be the trigger?
Research and analysis is what we do. If you’re interested in learning more about Visual Approach Research, let us know.
You should do a chart on…
If you could choose one topic you’d like us to dive deeper into, what would it be?

AI-generated chart that shows… well… nothing.
We like to create valuable charts. But, it’s not easy coming up with new ideas amid the endless hours delivering a data-driven edge to our customers. In our quest to provide a valuable weekly newsletter we can keep guessing what you find most valuable, or you could just tell us.
Reply to this email and let us know what analysis you’d find most valuable. We’d love to hear from you and will happily name-drop.
ACCESS OUR DATA AND ANALYSIS
We provide bespoke analysis to investors, lessors, and airlines looking for an edge in the market.
Our approach to analysis is data-driven and contrarian, seeking perspectives to lead the market, question consensus, and find emerging trends.
If a whole new approach to analysis could provide value to your organization, let's chat.
If you were forwarded this email, score!
As valuable as it is, don't worry, it's entirely free. If you would like to receive analyses like this regularly, subscribe below.
Then...
You can pay it forward by sending it to your colleagues. They gain valuable insights, and you get credit for finding new ideas!
Win-win!
Contact us
Have a question? Want to showcase your organization in a sponsored analysis? Reach out.
It’s easy. Just reply to this email.
Or, if you prefer the old way of clicking a link, we can help with the hard part: contact us.


